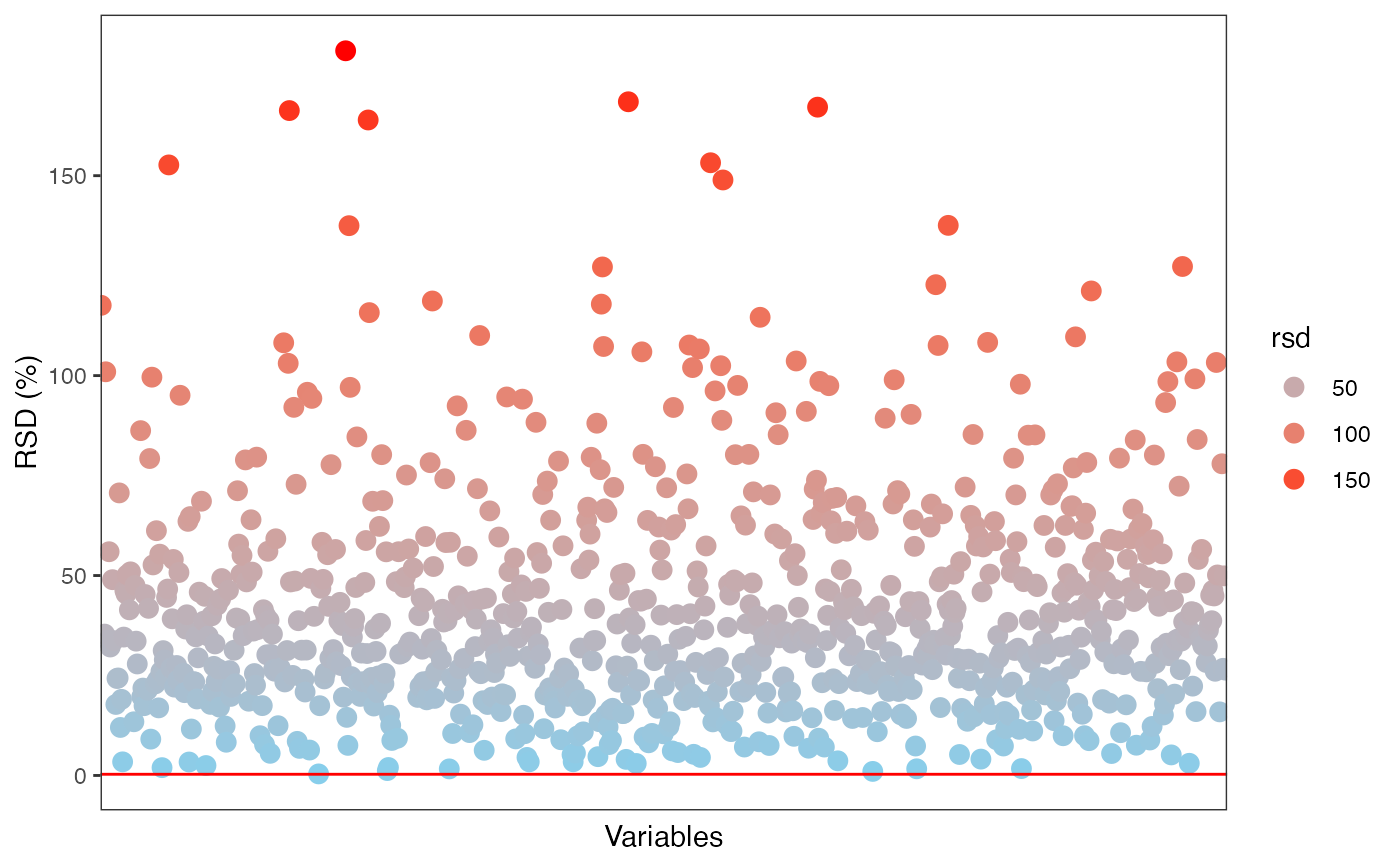
RSD plot for each variable.
massqc_rsd_plot(
  object,
  color_by,
  order_by = "variable_id",
  show_x_text = FALSE,
  show_x_ticks = FALSE,
  desc = FALSE,
  point_alpha = 0.8,
  point_size = 3
)
Arguments
- object
tidymass-class object.
- color_by
which column (sample_info) is used to color samples
- order_by
which column (sample_info) is used to order samples
- show_x_text
show_x_text
- show_x_ticks
show_x_ticks
- desc
desc
- point_alpha
point_alpha
- point_size
point_size
Value
ggplot2 plot.
Examples
library(massdataset)
library(ggplot2)
data("expression_data")
data("sample_info")
data("variable_info")
object =
create_mass_dataset(
expression_data = expression_data,
sample_info = sample_info,
variable_info = variable_info
)
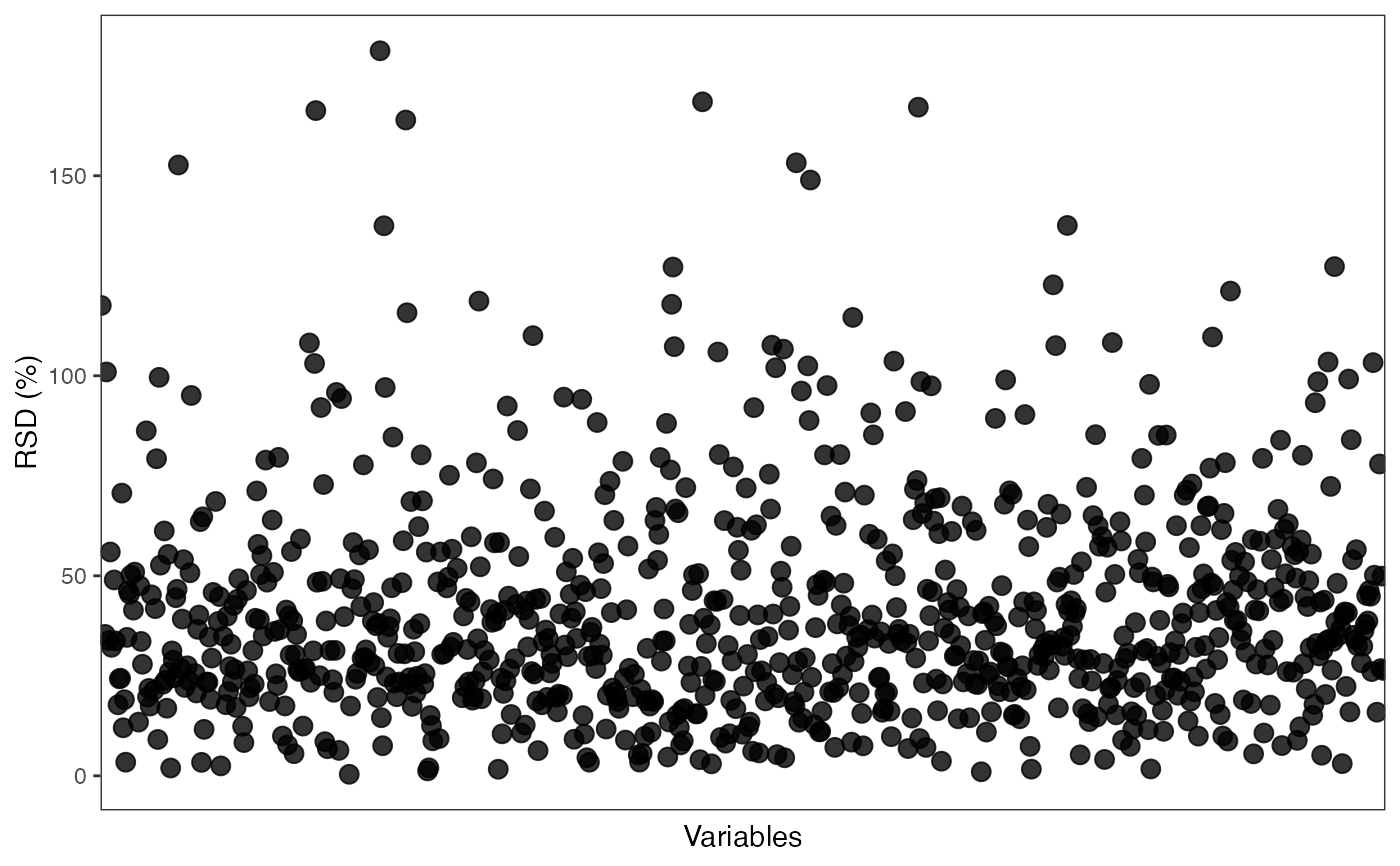
object %>%
massqc_rsd_plot()
#> Warning: Removed 140 rows containing missing values (geom_point).
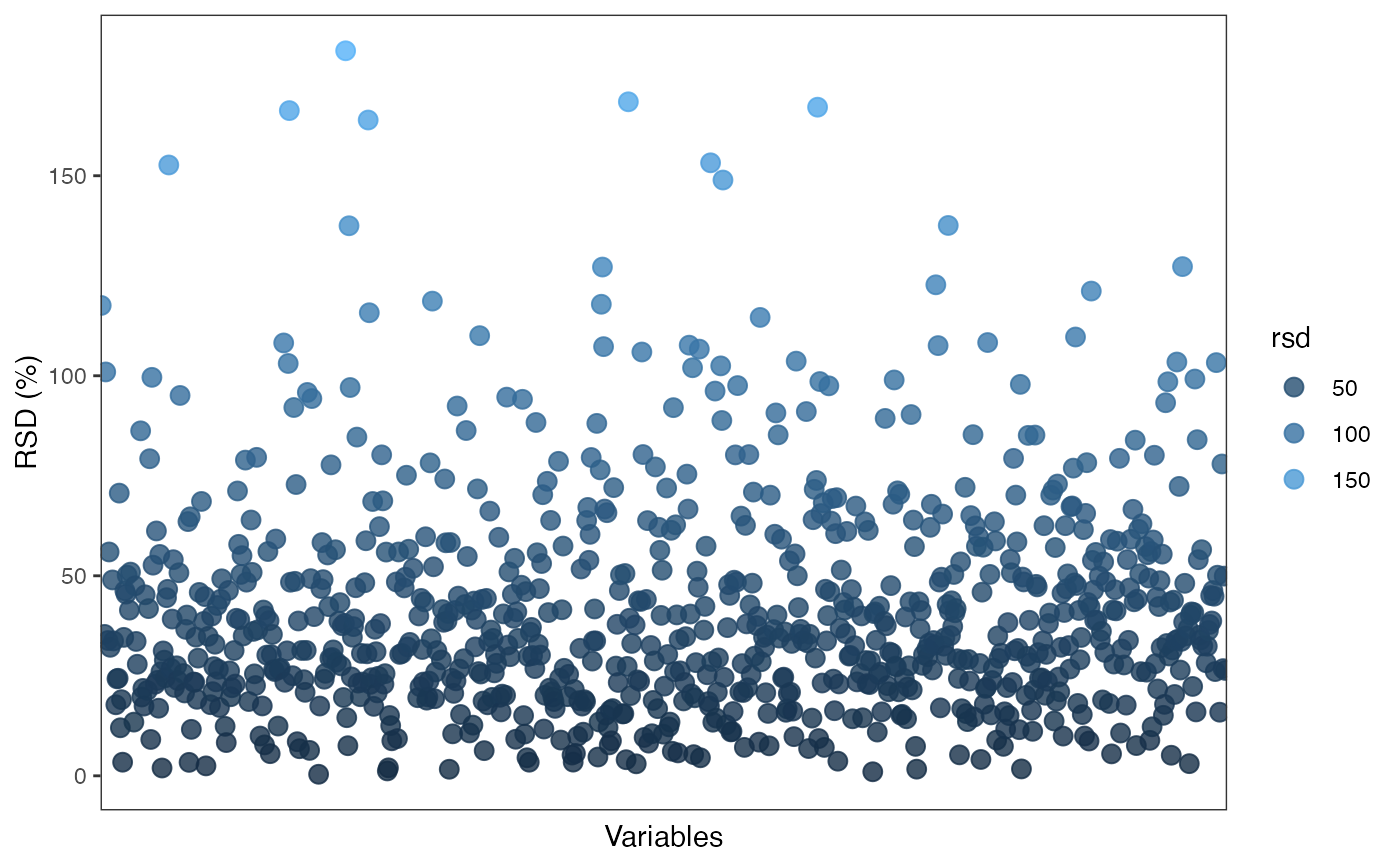
 object %>%
massqc_rsd_plot(color_by = "rsd")
#> Warning: Removed 140 rows containing missing values (geom_point).
object %>%
massqc_rsd_plot(color_by = "rsd")
#> Warning: Removed 140 rows containing missing values (geom_point).
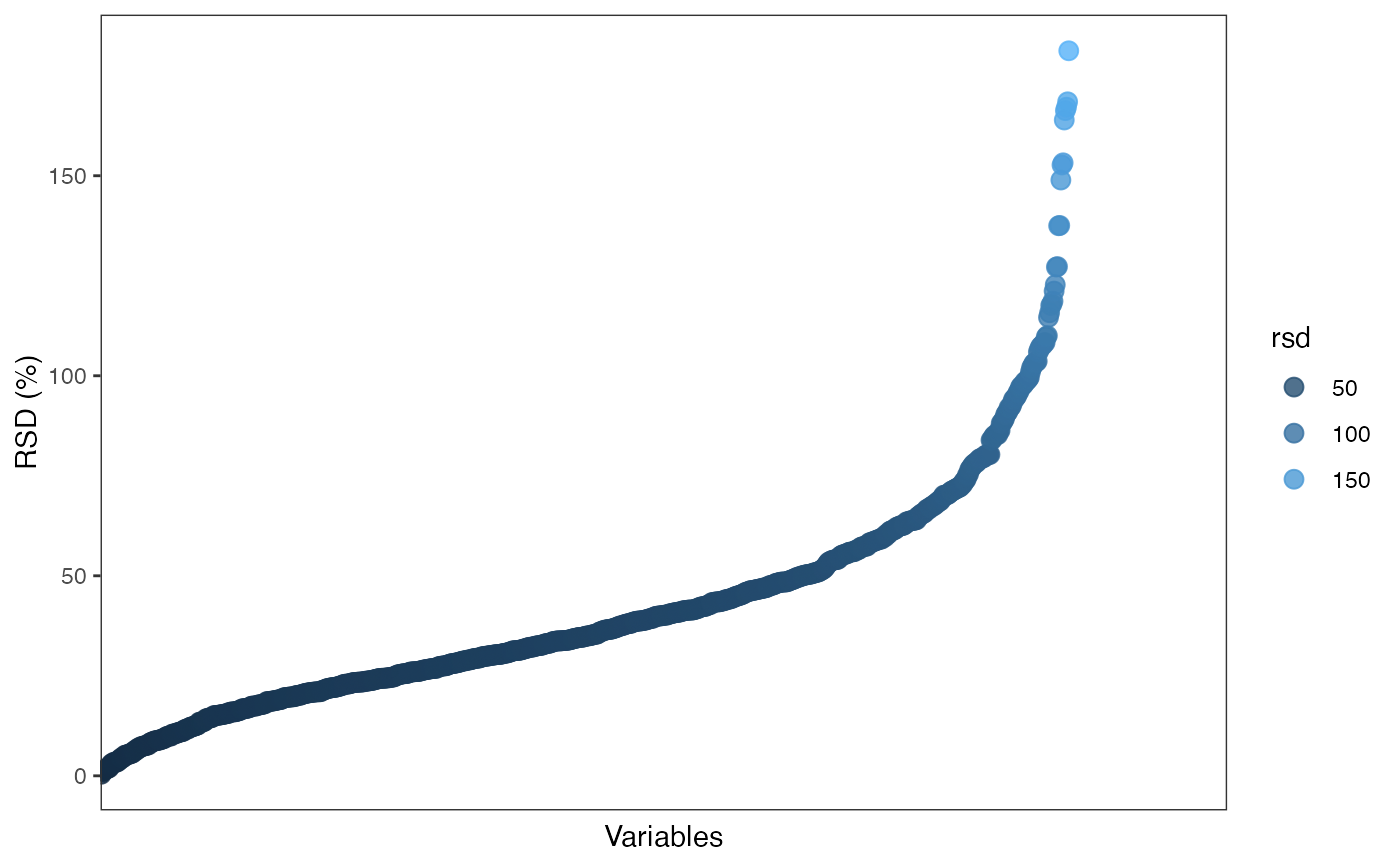
 object %>%
massqc_rsd_plot(color_by = "rsd", order_by = "rsd")
#> Warning: Removed 140 rows containing missing values (geom_point).
object %>%
massqc_rsd_plot(color_by = "rsd", order_by = "rsd")
#> Warning: Removed 140 rows containing missing values (geom_point).
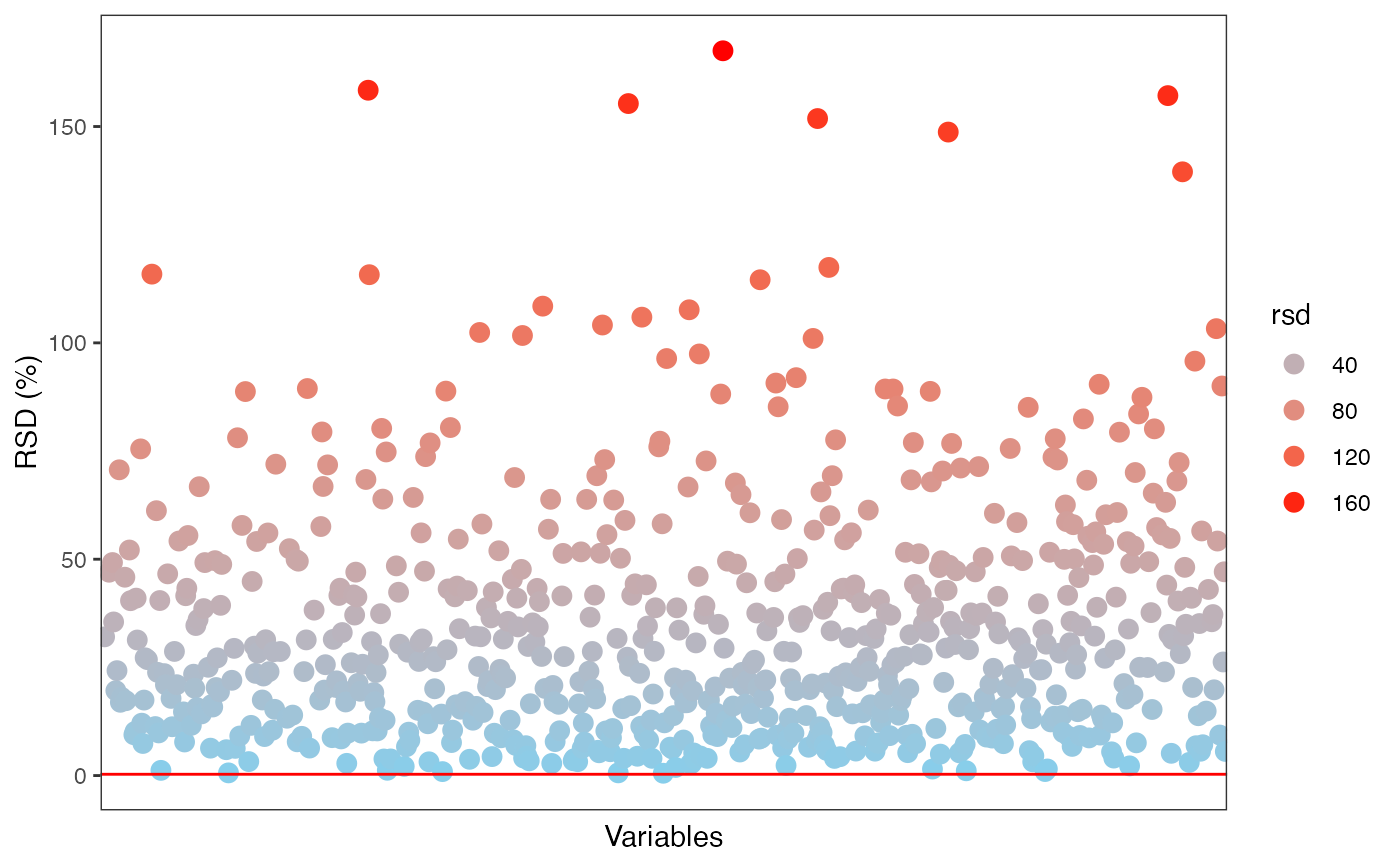
 object %>%
massqc_rsd_plot(color_by = "rsd", point_alpha = 1) +
scale_color_gradient(low = "skyblue", high = "red") +
geom_hline(yintercept = 0.3, color = "red")
#> Warning: Removed 140 rows containing missing values (geom_point).
object %>%
massqc_rsd_plot(color_by = "rsd", point_alpha = 1) +
scale_color_gradient(low = "skyblue", high = "red") +
geom_hline(yintercept = 0.3, color = "red")
#> Warning: Removed 140 rows containing missing values (geom_point).
 object %>%
activate_mass_dataset(what = "sample_info") %>%
filter(class == "Subject") %>%
massqc_rsd_plot(color_by = "rsd", point_alpha = 1) +
scale_color_gradient(low = "skyblue", high = "red") +
geom_hline(yintercept = 0.3, color = "red")
#> Warning: Removed 325 rows containing missing values (geom_point).
object %>%
activate_mass_dataset(what = "sample_info") %>%
filter(class == "Subject") %>%
massqc_rsd_plot(color_by = "rsd", point_alpha = 1) +
scale_color_gradient(low = "skyblue", high = "red") +
geom_hline(yintercept = 0.3, color = "red")
#> Warning: Removed 325 rows containing missing values (geom_point).