Filter noisy variables and outlier samples
Xiaotao Shen (https://www.shenxt.info/)
Created on 2020-04-01 and updated on 2022-08-07
Source:vignettes/filter_variable_outlier.Rmd
filter_variable_outlier.RmdIntroduction
We can use masscleaner to remove noisy features and
outlier samples.
First, we need to prepare samples for masscleaner.
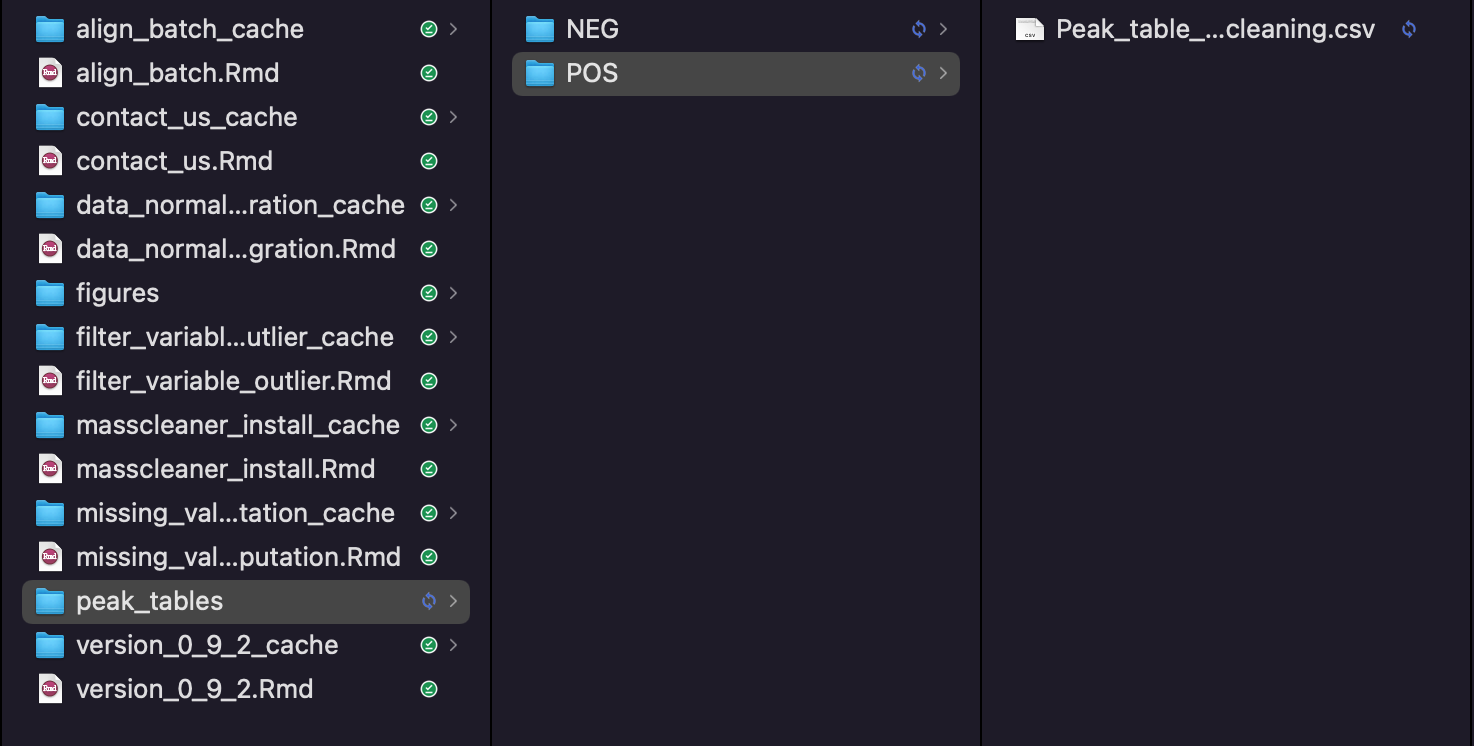
Download the demo data: peak tables and uncompress.

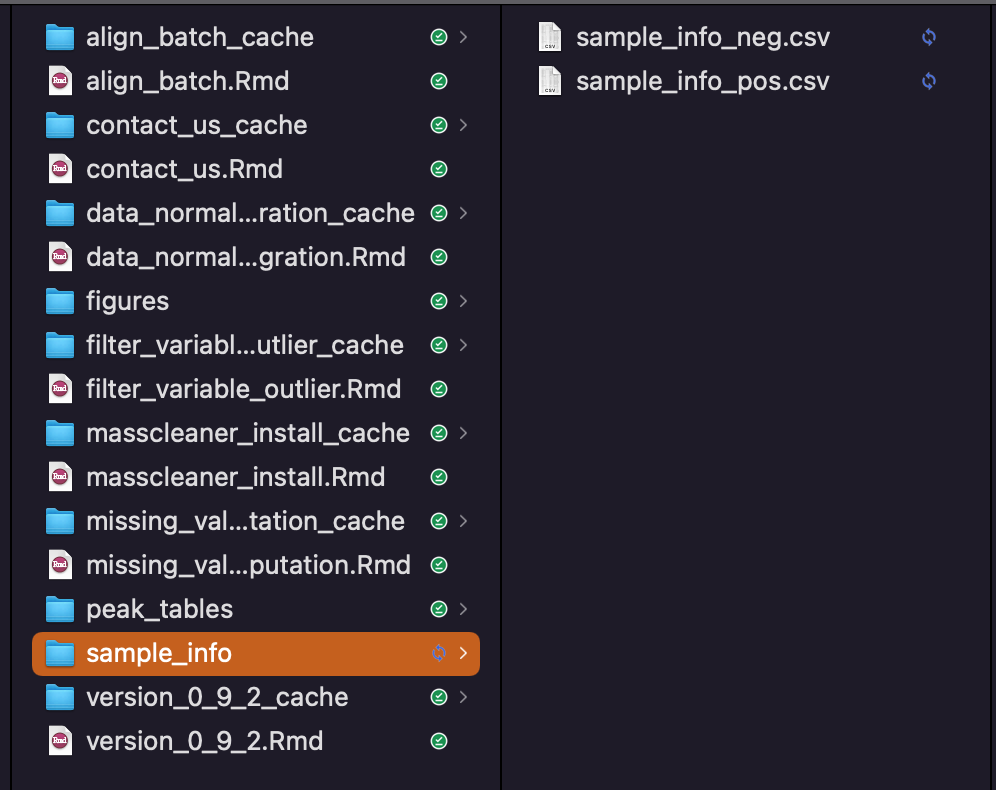
Download the demo data: sample information and uncompress.

Data preparation
Here we only use the positive mode as an example.
peak_table_pos = readr::read_csv("peak_tables/POS/Peak_table_for_cleaning.csv") %>%
  as.data.frame()
#> Rows: 10149 Columns: 262
#> ── Column specification ────────────────────────────────────────────────────────
#> Delimiter: ","
#> chr   (1): variable_id
#> dbl (261): mz, rt, sample_06, sample_103, sample_11, sample_112, sample_117,...
#>
#> ℹ Use `spec()` to retrieve the full column specification for this data.
#> ℹ Specify the column types or set `show_col_types = FALSE` to quiet this message.
sample_info_pos = readr::read_csv("sample_info/sample_info_pos.csv") %>%
  as.data.frame()
#> Rows: 259 Columns: 6
#> ── Column specification ────────────────────────────────────────────────────────
#> Delimiter: ","
#> chr (4): sample_id, class, subject_id, group
#> dbl (2): injection.order, batch
#>
#> ℹ Use `spec()` to retrieve the full column specification for this data.
#> ℹ Specify the column types or set `show_col_types = FALSE` to quiet this message.
expression_data_pos <-
  peak_table_pos %>%
  dplyr::select(-c(variable_id, mz, rt))

variable_info_pos <-
  peak_table_pos %>%
  dplyr::select(c(variable_id, mz, rt))

rownames(expression_data_pos) = variable_info_pos$variable_id
dim(expression_data_pos)
#> [1] 10149   259
dim(sample_info_pos)
#> [1] 259   6
colnames(expression_data_pos) == sample_info_pos$sample_id
#>   [1] FALSE FALSE FALSE FALSE FALSE FALSE FALSE FALSE FALSE FALSE FALSE FALSE
#>  [13] FALSE FALSE FALSE FALSE FALSE FALSE FALSE FALSE FALSE FALSE FALSE FALSE
#>  [25] FALSE FALSE FALSE FALSE FALSE FALSE FALSE FALSE FALSE FALSE FALSE FALSE
#>  [37] FALSE FALSE FALSE FALSE FALSE FALSE FALSE FALSE FALSE FALSE FALSE FALSE
#>  [49] FALSE FALSE FALSE FALSE FALSE FALSE FALSE FALSE FALSE FALSE FALSE FALSE
#>  [61] FALSE FALSE FALSE FALSE FALSE FALSE FALSE FALSE FALSE FALSE FALSE FALSE
#>  [73] FALSE FALSE FALSE FALSE FALSE FALSE FALSE FALSE FALSE FALSE FALSE FALSE
#>  [85] FALSE FALSE FALSE FALSE FALSE FALSE FALSE FALSE FALSE FALSE FALSE FALSE
#>  [97] FALSE FALSE FALSE FALSE FALSE FALSE FALSE FALSE FALSE FALSE FALSE FALSE
#> [109] FALSE FALSE FALSE FALSE FALSE FALSE FALSE FALSE FALSE FALSE FALSE FALSE
#> [121] FALSE FALSE FALSE FALSE FALSE FALSE FALSE FALSE FALSE FALSE FALSE FALSE
#> [133] FALSE FALSE FALSE FALSE FALSE FALSE FALSE FALSE FALSE FALSE FALSE FALSE
#> [145] FALSE FALSE FALSE FALSE FALSE FALSE FALSE FALSE FALSE FALSE FALSE FALSE
#> [157] FALSE FALSE FALSE FALSE FALSE FALSE  TRUE FALSE FALSE FALSE FALSE FALSE
#> [169] FALSE FALSE FALSE FALSE FALSE FALSE FALSE FALSE FALSE FALSE FALSE FALSE
#> [181] FALSE FALSE FALSE FALSE FALSE FALSE FALSE FALSE FALSE FALSE FALSE FALSE
#> [193] FALSE FALSE FALSE FALSE FALSE FALSE FALSE FALSE FALSE FALSE FALSE FALSE
#> [205] FALSE FALSE FALSE FALSE FALSE FALSE FALSE FALSE FALSE FALSE FALSE FALSE
#> [217] FALSE FALSE FALSE FALSE FALSE FALSE FALSE FALSE FALSE FALSE FALSE FALSE
#> [229] FALSE FALSE FALSE FALSE FALSE FALSE FALSE FALSE FALSE FALSE FALSE FALSE
#> [241] FALSE FALSE FALSE FALSE FALSE FALSE FALSE FALSE FALSE FALSE FALSE FALSE
#> [253] FALSE FALSE FALSE FALSE FALSE FALSE FALSE
expression_data_pos =
  expression_data_pos[,sample_info_pos$sample_id]
sum(colnames(expression_data_pos) == sample_info_pos$sample_id)
#> [1] 259
object <-
  create_mass_dataset(expression_data = expression_data_pos,
                      sample_info = sample_info_pos,
                      variable_info = variable_info_pos)
object
#> --------------------
#> massdataset version: 0.99.1
#> --------------------
#> 1.expression_data:[ 10149 x 259 data.frame]
#> 2.sample_info:[ 259 x 6 data.frame]
#> 3.variable_info:[ 10149 x 3 data.frame]
#> 4.sample_info_note:[ 6 x 2 data.frame]
#> 5.variable_info_note:[ 3 x 2 data.frame]
#> 6.ms2_data:[ 0 variables x 0 MS2 spectra]
#> --------------------
#> Processing information (extract_process_info())
#> create_mass_dataset ----------
#>       Package         Function.used                Time
#> 1 massdataset create_mass_dataset() 2022-01-17 23:07:04
Summary information.
get_mv_number(object)
#> [1] 785821
massdataset::get_mv_number(object, by = "sample") %>%
  head()
#> sample_QC_01    sample_01    sample_02    sample_06    sample_07    sample_11
#>         4410         4562         4298         4016         4365         4063
head(massdataset::get_mv_number(object, by = "variable"))
#>  M70T73_POS  M70T53_POS M70T183_POS M70T527_POS M71T695_POS M71T183_POS
#>         129          16         155          54         133         169

massdataset::get_mv_number(object, by = "sample", show_by = "percentage") %>%
  head()
#> sample_QC_01    sample_01    sample_02    sample_06    sample_07    sample_11
#>    0.4345256    0.4495024    0.4234900    0.3957040    0.4300916    0.4003350
head(massdataset::get_mv_number(object, by = "variable"), show_by = "percentage")
#>  M70T73_POS  M70T53_POS M70T183_POS M70T527_POS M71T695_POS M71T183_POS
#>         129          16         155          54         133         169
Filter noisy features
Remove variables who have mv in more than 20% QC samples and in at lest 50% samples in control group or case group.
object %>%
  activate_mass_dataset(what = "sample_info") %>%
  dplyr::count(group)
#>     group   n
#> 1    Case 110
#> 2 Control 110
#> 3      QC  39
show_variable_missing_values(object = object,
                             percentage = TRUE) +
  scale_size_continuous(range = c(0.01, 2))
qc_id =
  object %>%
  activate_mass_dataset(what = "sample_info") %>%
  filter(class == "QC") %>%
  pull(sample_id)

control_id =
  object %>%
  activate_mass_dataset(what = "sample_info") %>%
  filter(group == "Control") %>%
  pull(sample_id)

case_id =
  object %>%
  activate_mass_dataset(what = "sample_info") %>%
  filter(group == "Case") %>%
  pull(sample_id)

object =
  object %>%
  mutate_variable_na_freq(according_to_samples = qc_id) %>%
  mutate_variable_na_freq(according_to_samples = control_id) %>%
  mutate_variable_na_freq(according_to_samples = case_id)

head(extract_variable_info(object))
#>   variable_id       mz        rt    na_freq na_freq.1 na_freq.2
#> 1  M70T73_POS 70.04074  73.31705 0.28205128 0.6000000 0.4727273
#> 2  M70T53_POS 70.06596  52.78542 0.00000000 0.1454545 0.0000000
#> 3 M70T183_POS 70.19977 182.87981 0.00000000 0.6636364 0.7454545
#> 4 M70T527_POS 70.36113 526.76657 0.02564103 0.1818182 0.3000000
#> 5 M71T695_POS 70.56911 694.84592 0.02564103 0.6454545 0.5545455
#> 6 M71T183_POS 70.75034 182.77790 0.05128205 0.7272727 0.7909091
object <-
  object %>%
  activate_mass_dataset(what = "variable_info") %>%
  filter(na_freq < 0.2 & (na_freq.1 < 0.5 | na_freq.2 < 0.5))
object
#> --------------------
#> massdataset version: 0.99.1
#> --------------------
#> 1.expression_data:[ 5101 x 259 data.frame]
#> 2.sample_info:[ 259 x 6 data.frame]
#> 3.variable_info:[ 5101 x 6 data.frame]
#> 4.sample_info_note:[ 6 x 2 data.frame]
#> 5.variable_info_note:[ 6 x 2 data.frame]
#> 6.ms2_data:[ 0 variables x 0 MS2 spectra]
#> --------------------
#> Processing information (extract_process_info())
#> create_mass_dataset ----------
#>       Package         Function.used                Time
#> 1 massdataset create_mass_dataset() 2022-01-17 23:07:04
#> mutate_variable_na_freq ----------
#>       Package             Function.used                Time
#> 1 massdataset mutate_variable_na_freq() 2022-01-17 23:07:09
#> 2 massdataset mutate_variable_na_freq() 2022-01-17 23:07:09
#> 3 massdataset mutate_variable_na_freq() 2022-01-17 23:07:09
#> filter ----------
#>       Package Function.used                Time
#> 1 massdataset      filter() 2022-01-17 23:07:10
show_variable_missing_values(object = object[,qc_id],
                             percentage = TRUE)
show_variable_missing_values(object = object[,control_id],
                             percentage = TRUE)
show_variable_missing_values(object = object[,case_id],
                             percentage = TRUE)
object %>%
  activate_mass_dataset(what = "variable_info") %>%
  dplyr::filter(na_freq.1 > 0.5) %>%
  extract_variable_info() %>%
  ggplot(aes(na_freq.1, na_freq.2)) +
  geom_point() +
  scale_x_continuous(limits = c(0,1)) +
  scale_y_continuous(limits = c(0,1))
object %>%
  activate_mass_dataset(what = "variable_info") %>%
  dplyr::filter(na_freq.2 > 0.5) %>%
  extract_variable_info() %>%
  ggplot(aes(na_freq.1, na_freq.2)) +
  geom_point() +
  scale_x_continuous(limits = c(0,1)) +
  scale_y_continuous(limits = c(0,1))
Filter outlier samples
We can use the detect_outlier() to find the outlier
samples.
More information about how to detect outlier samples can be found here.
massdataset::show_sample_missing_values(object = object,
                                        color_by = "group",
                                        order_by = "injection.order",
                                        percentage = TRUE) +
  ggsci::scale_color_aaas()
Detect outlier samples.
outlier_samples =
  object %>%
  `+`(1) %>%
  log(2) %>%
  scale() %>%
  detect_outlier()

outlier_samples
#> --------------------
#> masscleaner
#> --------------------
#> 1 according_to_na : 0 outlier samples.
#> 2 according_to_pc_sd : 0 outlier samples.
#> 3 according_to_pc_mad : 0 outlier samples.
#> 4 accordint_to_distance : 0 outlier samples.
#> extract all outlier table using extract_outlier_table()
#>
outlier_table <-
extract_outlier_table(outlier_samples)
outlier_table %>%
  head()
#>              according_to_na pc_sd pc_mad accordint_to_distance
#> sample_QC_01           FALSE FALSE  FALSE                 FALSE
#> sample_01              FALSE FALSE  FALSE                 FALSE
#> sample_02              FALSE FALSE  FALSE                 FALSE
#> sample_06              FALSE FALSE  FALSE                 FALSE
#> sample_07              FALSE FALSE  FALSE                 FALSE
#> sample_11 FALSE FALSE FALSE FALSENo outlier samples.
Save data for next analysis.
save(object, file = "peak_tables/POS/object")Session information
sessionInfo()
#> R Under development (unstable) (2022-01-11 r81473)
#> Platform: x86_64-apple-darwin17.0 (64-bit)
#> Running under: macOS Big Sur/Monterey 10.16
#>
#> Matrix products: default
#> BLAS:   /Library/Frameworks/R.framework/Versions/4.2/Resources/lib/libRblas.0.dylib
#> LAPACK: /Library/Frameworks/R.framework/Versions/4.2/Resources/lib/libRlapack.dylib
#>
#> locale:
#> [1] en_US.UTF-8/en_US.UTF-8/en_US.UTF-8/C/en_US.UTF-8/en_US.UTF-8
#>
#> attached base packages:
#> [1] stats     graphics  grDevices utils     datasets  methods   base
#>
#> other attached packages:
#>  [1] forcats_0.5.1      stringr_1.4.0      dplyr_1.0.7        purrr_0.3.4
#>  [5] readr_2.1.1        tidyr_1.1.4        tibble_3.1.6       ggplot2_3.3.5
#>  [9] tidyverse_1.3.1    magrittr_2.0.1     tinytools_0.9.1    massdataset_0.99.1
#> [13] masscleaner_0.9.2
#>
#> loaded via a namespace (and not attached):
#>   [1] colorspace_2.0-2      rjson_0.2.21          ellipsis_0.3.2
#>   [4] class_7.3-20          leaflet_2.0.4.1       rprojroot_2.0.2
#>   [7] circlize_0.4.14       GlobalOptions_0.1.2   fs_1.5.2
#>  [10] clue_0.3-60           rstudioapi_0.13       proxy_0.4-26
#>  [13] farver_2.1.0          bit64_4.0.5           ggrepel_0.9.1
#>  [16] lubridate_1.8.0       fansi_1.0.0           mvtnorm_1.1-2
#>  [19] xml2_1.3.3            codetools_0.2-18      doParallel_1.0.16
#>  [22] cachem_1.0.6          impute_1.69.0         robustbase_0.93-8
#>  [25] knitr_1.37            itertools_0.1-3       jsonlite_1.7.2
#>  [28] broom_0.7.11          dbplyr_2.1.1          cluster_2.1.2
#>  [31] png_0.1-7             missForest_1.4        rrcov_1.6-0
#>  [34] compiler_4.2.0        httr_1.4.2            backports_1.4.1
#>  [37] assertthat_0.2.1      fastmap_1.1.0         lazyeval_0.2.2
#>  [40] cli_3.1.0             htmltools_0.5.2       tools_4.2.0
#>  [43] gtable_0.3.0          glue_1.6.0            Rcpp_1.0.7
#>  [46] Biobase_2.55.0        cellranger_1.1.0      jquerylib_0.1.4
#>  [49] pkgdown_2.0.1         vctrs_0.3.8           iterators_1.0.13
#>  [52] crosstalk_1.2.0       xfun_0.29             rvest_1.0.2
#>  [55] openxlsx_4.2.5        lifecycle_1.0.1       DEoptimR_1.0-10
#>  [58] MASS_7.3-55           scales_1.1.1          vroom_1.5.7
#>  [61] ragg_1.2.1            pcaMethods_1.87.0     clisymbols_1.2.0
#>  [64] hms_1.1.1             parallel_4.2.0        RColorBrewer_1.1-2
#>  [67] ComplexHeatmap_2.11.0 yaml_2.2.1            memoise_2.0.1
#>  [70] pbapply_1.5-0         yulab.utils_0.0.4     sass_0.4.0
#>  [73] stringi_1.7.6         highr_0.9             S4Vectors_0.33.10
#>  [76] desc_1.4.0            pcaPP_1.9-74          foreach_1.5.1
#>  [79] randomForest_4.6-14   e1071_1.7-9           BiocGenerics_0.41.2
#>  [82] zip_2.2.0             BiocParallel_1.29.10  shape_1.4.6
#>  [85] rlang_0.4.12          pkgconfig_2.0.3       systemfonts_1.0.3
#>  [88] matrixStats_0.61.0    evaluate_0.14         lattice_0.20-45
#>  [91] labeling_0.4.2        patchwork_1.1.1       htmlwidgets_1.5.4
#>  [94] bit_4.0.4             tidyselect_1.1.1      robust_0.6-1
#>  [97] ggsci_2.9             plyr_1.8.6            R6_2.5.1
#> [100] IRanges_2.29.1        snow_0.4-4            generics_0.1.1
#> [103] fit.models_0.64       DBI_1.1.2             withr_2.4.3
#> [106] haven_2.4.3           pillar_1.6.4          modelr_0.1.8
#> [109] crayon_1.4.2          utf8_1.2.2            plotly_4.10.0
#> [112] tzdb_0.2.0            rmarkdown_2.11        GetoptLong_1.0.5
#> [115] grid_4.2.0            readxl_1.3.1          data.table_1.14.2
#> [118] reprex_2.0.1          digest_0.6.29         gridGraphics_0.5-1
#> [121] textshaping_0.3.6     stats4_4.2.0          munsell_0.5.0
#> [124] viridisLite_0.4.0     ggplotify_0.1.0       bslib_0.3.1